 |
| EURGBP appears to be creating a double bottom with it's mid-2010 low. I believe this level will serve as a launching point for a move which should exceed .908. This presents an excellent risk-reward ratio for this trade. If this chart is correct, it may make more sense to short GBPUSD instead of this pair as I expect EURUSD to remain weak for over the next few years. |
Showing posts with label currency trading. Show all posts
Showing posts with label currency trading. Show all posts
Tuesday, April 24, 2012
EURGBP Bottom in place?
Monday, April 9, 2012
EURUSD - Heading higher?
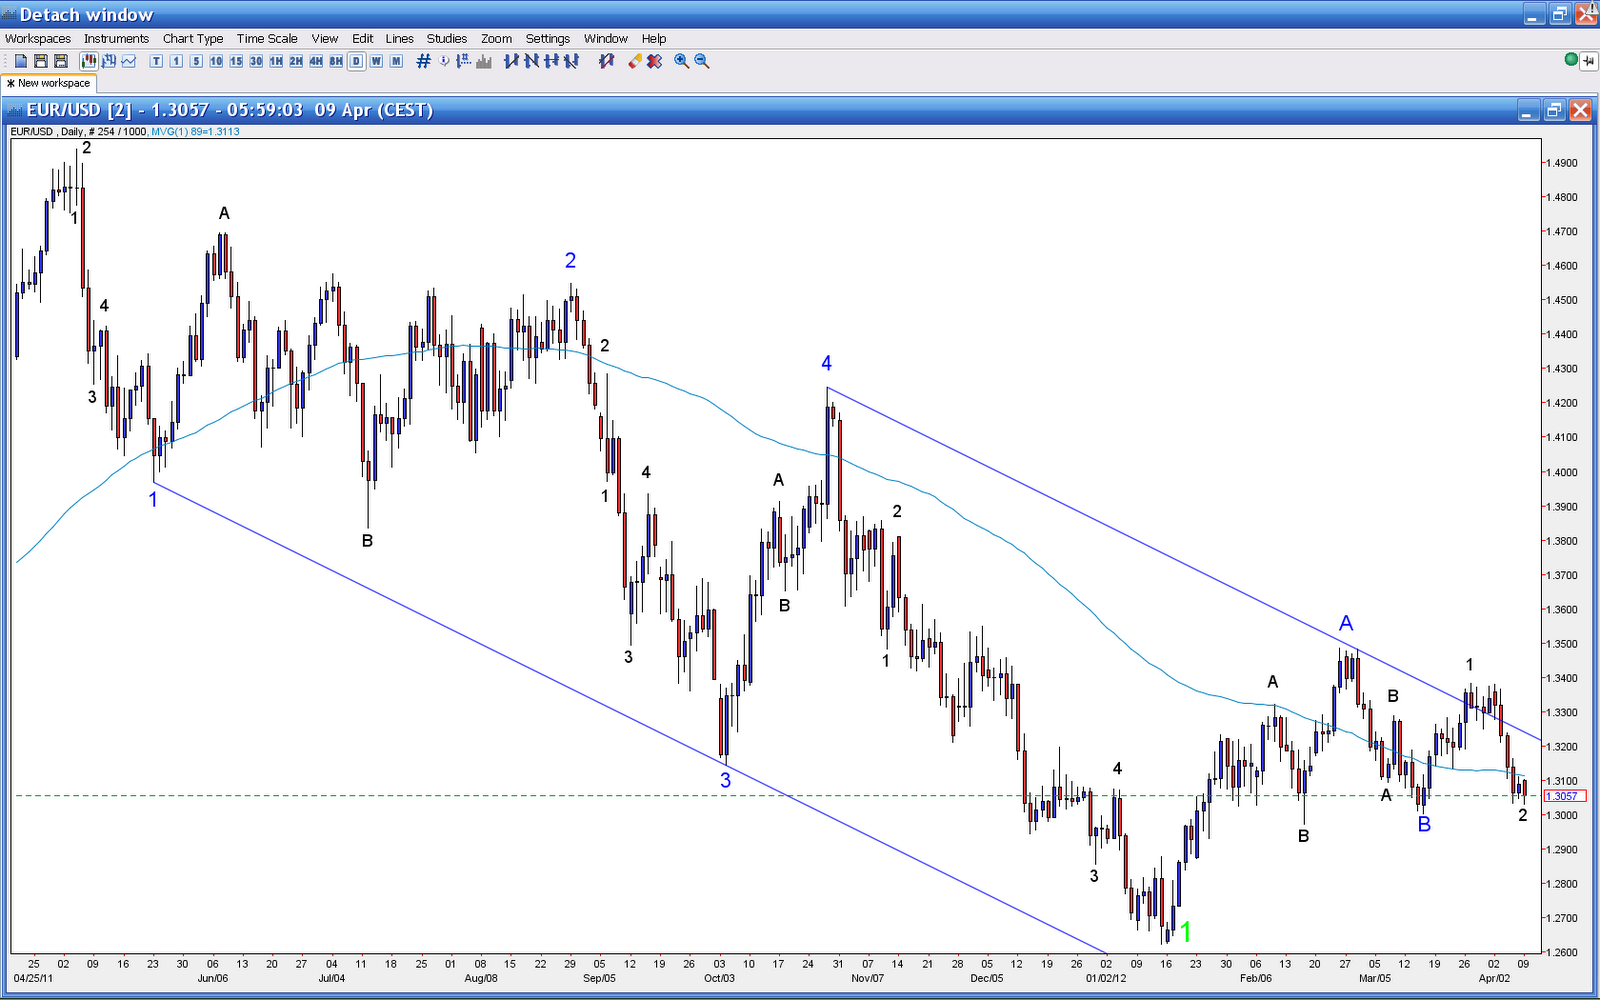 |
| The EURUSD's current set-up either a fairly medium term bullish or imminently long term bearish. The line in the sand between these two outcomes is the low of Wave B Blue. I still believe that the Euro has further to run toward the upside as it tends to top after the stock market at significant turns, but it could certainly head in either direction. If it does breakdown, it would project a measured move to at least 1.25. Either case offers significant trading potential. |
Tuesday, April 3, 2012
AUDUSD Critical Juncture
 |
| AUDUSD remains at a decision point. It can either breakdown to new lows or begin a final impulse higher. This secondary support must not be breached significantly in order for this count to remain valid. Either way this breaks, I expect to see large moves. |
Sunday, April 1, 2012
GBPJPY D Wave Complete
 |
| There appears to be at least one three wave move lower in the GBPJPY before higher levels are seen. Usually a third test of a significant level of resistance gives way. However in this case, as Wave C Green did not register new lows, it is likely that the current thrust will not make new highs yet. With the invalidation point nearby, a short from current levels seems justified. |
Thursday, March 29, 2012
AUDUSD to rally past 1.085
 |
| AUDUSD appears set to rally higher in a final impulse in order to complete the larger degree correction from .9386. I would expect this to complete as a double top between 1.095 and 1.105 in order to create the relationships Wave 5 Green = 61.8% of Wave 3 Green and Wave C Red = Wave A Red, respectively. A more significant break below the trendline drawn (which connects the origins of Wave A Red and Wave C Red) would make this wave count extremely unlikely. |
Wednesday, March 14, 2012
GBPJPY decline ahead?
 |
| GBPJPY appears to have completed either a Wave 3 Green impulse or a Wave C Green correction. In either case, the short term view appears to indicate lower prices. If prices breach the Wave 1/A high, it is likely that new lows will be made eventually. |
Thursday, March 8, 2012
GBPJPY Head and Shoulders topping pattern
 |
| The British Pound versus the Yen has created a significant Head and shoulders patter over the last few trading days and appears to be set to begin a fresh impulse to new lows. As the recent decline has penetrated the top of Wave A Green, it is unlikely that we are experiencing a Wave 4 Green Pullback. However, where we are in the larger time frame is still unclear to me. |
Wednesday, February 29, 2012
AUDUSD impulsive decline on 1 minute charts
 |
| This displays a five wave decline in the AUDUSD, which has a very high correlation to the S&P 500. I believe that this is the very forefront of a much larger move lower in virtually every asset over the coming months. The most notable exceptions will likely be the US dollar and treasuries in a flight to liquidity. |
Tuesday, February 28, 2012
NZDUSD potentially topping?
 |
| The NZDUSD may be forming an ending diagonal which has created new highs and also touched a key resistance line for this Wave 2 Red higher. In addition, Wave 5 Blue is 127.3% the length of Wave 1 Blue although not shown. |
Friday, February 24, 2012
USDSEK Dual Support Convergence
 |
| USDSEK appears set to rally strongly given that it is sitting on significant monthly trendline support. If trendline support does not hold this count is not invalidated unless 6.30 is breached. |
Wednesday, February 22, 2012
AUDUSD Detailed look at Wave 4 Red
 |
The AUDUSD appears to be completing a Wave 4 Red. Waves A
and C Green are almost at equality. Additionally, Wave 2 Red (shown in prior
post) and Wave 4 Red have reached equality. The previous post has more info
about where Wave 5 Red and more importantly, the next move, should lead.
|
Tuesday, February 21, 2012
AUDUSD long opportunity to set up amazing short entry
 |
| It seems we may be ready for one last thrust higher in the AUDUSD above the recent 1.084 barrier, but below the all time high of 1.108. This should present an incredible risk reward opportunity to enter into short positions. The resulting impulse should end around a conservative estimate of 2,500 pips lower. |
Monday, January 23, 2012
USDCAD Daily and Weekly Wave Counts
 |
| The USDCAD appears set to rally in a fifth wave higher. The breakout from this triangle projects a thrust to roughly the 1.11 level in a fifth wave. This setup offers an amazing risk to reward ratio trade with the invalidation point just below at 1.0050. |
 |
| However when looking at the weekly chart it appears that the upcoming fifth wave will break significant trendline resistance. The last time this occurred (in 2008), prices fell back to the former resistance trendline before exploding higher in an extremely powerful 3rd Wave. I believe a similar situation will present itself relatively soon. Ultimately, prices need to return to 1.3000+ in order to complete this Red Wave C. |
Thursday, January 12, 2012
EURNZD - Possibly concluding 3 year impluse
 |
| The EURNZD appears to be terminating an impulse which began three years ago nearly 10,000 pips higher. The spike on this weeks bar could potentially be the end, however the subdivisions of the current Wave 5 Blue are not readily apparent. A 15 minute view displays an obvious impulse higher. It is possible this merely the beginning of a Wave 4 Black of this Wave 5 Blue. In either case the short term momentum is higher. Therefore, I will attempt to enter into long positions at 1.6100 and 1.6035, with a stop loss at 1.5920. |
Wednesday, January 11, 2012
NZDUSD Wave 2 higher potentially complete
 |
| The New Zealand Dollar vs. the US$ appears to have completed a three wave correction higher off its November lows. This is likely a completed Wave 2 Green higher or perhaps only a three-wave correction in a Wave A Blue higher. In either case however, prices should move lower in the short term. Currently, Wave A Blue and Wave C Blue are roughly equal, and prices are just barely above channel resistance. As the subdivisions of Wave C Blue are labeled, Wave 2 Green cannot terminate above .8045. |
Wednesday, January 4, 2012
EURUSD Trending Higher?
 | |
| It appears that the EURUSD has completed five waves lower to complete a leading diagonal. This is the last leg of that diagonal. As long as prices do not significantly violate the trendline which has now become support, the EURUSD should shortly continue higher in a multi-month rally. |
Thursday, December 15, 2011
EURCHF low risk bullish setup
 |
| I think it's worth a shot at these levels. This should break to the upside and target around 1.27 given the measured move from a triangle break. |
Tuesday, December 13, 2011
EURUSD to begin Wave 2 higher?
 |
| Today's thrust lower in the EURUSD appears to have completed Wave 1 Green lower. It is currently facing the resistance of the 61.8% retracement of the B Wave as well as the center-line of it's channel. This may be a decent stopping point for the decline. Ideally, I would like to see an end of day rally to create a tail on the today's bar. The coming rally may match Wave A Green's peak in order to set up a massive Head and Shoulders pattern which will be broken in a Wave 3 Green lower. |
Monday, December 12, 2011
Euro heading higher?
 | |||||||||
| EURUSD appears to be completing its B wave Correction lower with a thrust under its channel support. What I have labeled as Wave 4 Black may actually be a part of Wave 3 Black with one more thrust to finish the decline. However, given the proximity to the origin of Wave A, I feel the risk/reward is justified as it is currently labeled. It
feels almost wrong to be bullish on the Euro given all the negative news lately,
but recently commercials have been buying Euros at record levels
according to the COT data. This usually corresponds to significant
bottoms in the EURUSD. |
Wednesday, December 7, 2011
USDHUF set for wave 5 decline?
 |
USDHUF appears to have completed a triangle to finish Wave 4 Green and should soon break to new lows in a Wave 5 Green. The 55 hour moving average has been fairly reliable resistance throughout this impulse lower. Therefore if price moves significantly higher than this moving average it is likely Wave 4 Green is still unfolding in a more complex correction.
This is a pair that I have only recently begun trading, but I feel that it exhibits more defined wave patterns than most highly liquid currency pairs. Perhaps, this is a result of a more localized populace trading this pair than the more liquid crosses, allowing their social mood (and therefore price) to fluctuate in unison.
|
Subscribe to:
Posts (Atom)