Showing posts with label day trading. Show all posts

Thursday, April 24, 2014

Finally a decent 5 wave impulse lower!

 
After what seems like forever going up, the market has created a very clear impulse lower followed by a three wave rally. Assuming the recent top sticks this creates a (very lopsided) head and shoulders pattern with March 7th as the left shoulder. At a minimum we are heading to the sub 1800's, but I believe that is an extremely conservative estimate.
 
The NASDAQ 100 chart shows the Head and Shoulders pattern far more textbook than does the S&P. The dates are somewhat different but they appear to be aligning at the right shoulder for the time being.
While this chart is a couple of weeks old, it display how on a logarithmic basis the recent all time highs were bumping into the lower end of this channel. These lines have been defining many of the significant market tops and bottoms over the last 30+ years. The bottom line is I believe we are currently at the very beginning of a new bear market.
 
 
*On a personal note, the reason I have let this page fall into a state of disuse is due to my current job as a Platoon Leader in the US Army. I cannot trade with the same focus as I could when I was in college; my primary duty is to my Soldiers and country. The demands of trading weigh on my mind too heavily to be dual focused on trading and training Soldiers. They deserve my all. I will continue to update when I feel there is something significant in the works, but still infrequently until I complete my service.
 

Sunday, February 10, 2013

NASDAQ - Head and Shoulders

The NASDAQ has failed to keep pace with the other main US indexes and appears to be creating a head and shoulders pattern. This may be due to the fact that the NASDAQ bottomed 4 months before the other US indexes and is now the first of the indexes to top. The NASDAQ's current price action appears to be encountering resistance from the former neckline of the smaller degree head and shoulders pattern. While prices will likely exceed this resistance, this will likely only create a short term price spike. A daily close firmly above the resistance line will likely indicate that this head and shoulders pattern is invalid and headed to new heights. In either case this line appears useful to determining the market's next move.


Monday, February 6, 2012

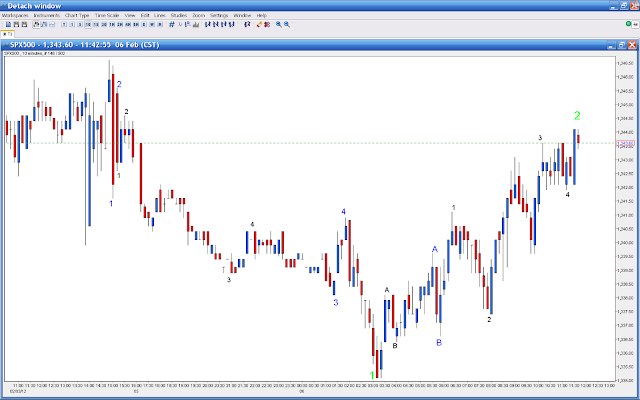
Possible 5 waves lower in S&P 500

I usually don't post my short term wave counts. However if this labeling is correct, we may have already seen the very first leg down of a much larger decline in Wave 3 or Wave C. The point is to remain very cautious until the market provides more clarity.

Tuesday, August 30, 2011

S&P 500 Short Term Chart

The recent bounce in the S&P 500 may be ending as it appears to be respecting its descending trendline which connects the lows of April 18th and June 16th. If my wave count is incorrect and price action breaks above the descending trendline, we can expect a sudden move to 1250.

Sunday, August 28, 2011

S&P 500 Mid Term Chart

The green line is a 55 period EMA which has shown a tendency to act a significant support and resistance; therefore, the path of least resistance should be lower.