Forex and S&P 500 charts. Primarily focused on Elliott Wave analysis yet all forms of technical analysis are appreciated.
Showing posts with label SPY. Show all posts
Showing posts with label SPY. Show all posts
Thursday, April 24, 2014
Tuesday, November 13, 2012
US Equity Market Rolling Over?
Tuesday, August 21, 2012
Potential S&P 500 Peak
Tuesday, February 28, 2012
Decade long S&P 500 channel resistance looming at 1382
Monday, February 6, 2012
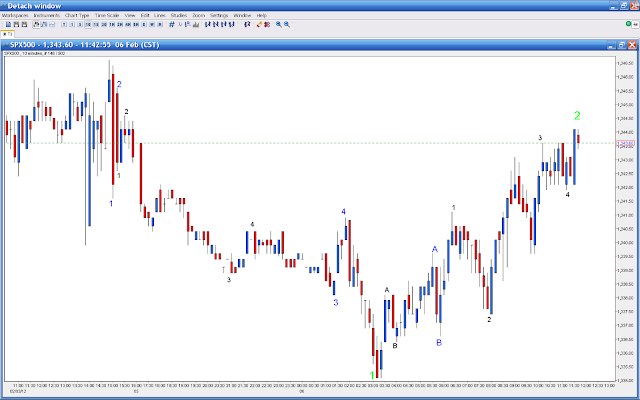
Possible 5 waves lower in S&P 500
Friday, February 3, 2012
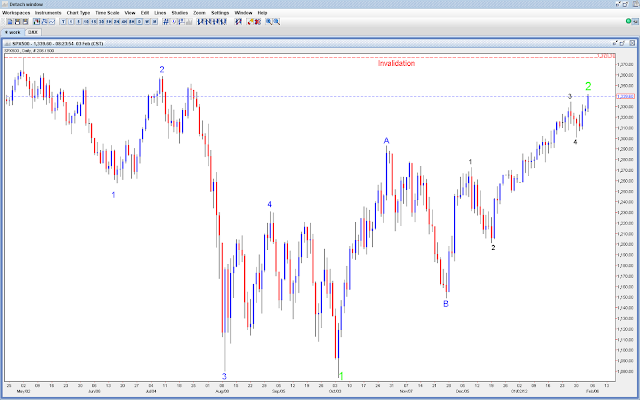
S&P 500 corrective rally appears complete
Thursday, December 1, 2011
S&P 500 Mid-Term Elliott Wave Count
Wednesday, November 30, 2011
S&P 500 B Wave Correction potentially complete
Wednesday, November 16, 2011
S&P 500 Triangle Consolidation Appears Complete
Wednesday, November 9, 2011
S&P 500 SHTF line
The S&P 500 has survived a test of 1225 which was already major support, but is now where the recent trendline resides. If and when this level of support is taken out, prepare for an extremely sharp long-term move lower. This should coincide with a sustained USD breakout.
|
Monday, October 3, 2011
S&P 500 ready to rally?
Thursday, September 22, 2011
S&P 500 to begin Wave 4 up?
 |
| Here is my current standing in CNBC's Million Dollar Portfolio challenge. All of my trades in this portfolio are based on the research I have posted to this blog. |
Tuesday, September 20, 2011
S&P 500 Hunt Volatility Funnel & Elliott Wave Count
Friday, September 9, 2011
S&P 500 Mid Term Chart Update
Tuesday, August 30, 2011
S&P 500 Short Term Chart
Labels:
cfd,
day trading,
investing,
SPX,
SPY,
stock market
Sunday, August 28, 2011
S&P 500 Mid Term Chart
Subscribe to:
Posts (Atom)


