Thursday, April 24, 2014

Finally a decent 5 wave impulse lower!

 
After what seems like forever going up, the market has created a very clear impulse lower followed by a three wave rally. Assuming the recent top sticks this creates a (very lopsided) head and shoulders pattern with March 7th as the left shoulder. At a minimum we are heading to the sub 1800's, but I believe that is an extremely conservative estimate.
 
The NASDAQ 100 chart shows the Head and Shoulders pattern far more textbook than does the S&P. The dates are somewhat different but they appear to be aligning at the right shoulder for the time being.
While this chart is a couple of weeks old, it display how on a logarithmic basis the recent all time highs were bumping into the lower end of this channel. These lines have been defining many of the significant market tops and bottoms over the last 30+ years. The bottom line is I believe we are currently at the very beginning of a new bear market.
 
 
*On a personal note, the reason I have let this page fall into a state of disuse is due to my current job as a Platoon Leader in the US Army. I cannot trade with the same focus as I could when I was in college; my primary duty is to my Soldiers and country. The demands of trading weigh on my mind too heavily to be dual focused on trading and training Soldiers. They deserve my all. I will continue to update when I feel there is something significant in the works, but still infrequently until I complete my service.
 

Sunday, February 10, 2013

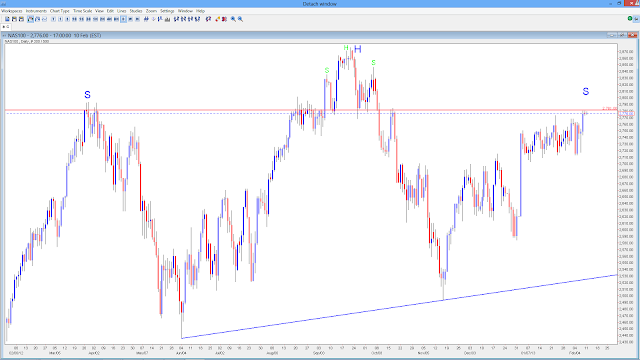
NASDAQ - Head and Shoulders

The NASDAQ has failed to keep pace with the other main US indexes and appears to be creating a head and shoulders pattern. This may be due to the fact that the NASDAQ bottomed 4 months before the other US indexes and is now the first of the indexes to top. The NASDAQ's current price action appears to be encountering resistance from the former neckline of the smaller degree head and shoulders pattern. While prices will likely exceed this resistance, this will likely only create a short term price spike. A daily close firmly above the resistance line will likely indicate that this head and shoulders pattern is invalid and headed to new heights. In either case this line appears useful to determining the market's next move.


Tuesday, November 13, 2012

US Equity Market Rolling Over?

It appears as though the S&P 500 may have finally completed the first of many (yet to come) impulses lower. The trend line shown is the last bastion of support which is why I believe that we will get a modest rally from here which should not take out the September 13th highs. Although this impulse lower appears as a leading diagonal, which it probably is, when viewed from the DJIA it appears as a normal impulse wave.
This chart offers a very simplistic view of why I believe the top is in. As far as I know, I am the only one who has been tracking this long term channel forming in the DJIA. The price action in the S&P 500 has not reached the upper boundary of the channel; however, aside from traders I believe the Dow Jones is more widely followed and therefore has more relevance.

Tuesday, August 21, 2012

Potential S&P 500 Peak

There exists some possibility that the market topped earlier today as a ending diagonal within an ending diagonal. I had expected this move to continue to roughly 1450 under this count but with the large daily reversal candle potentially signal immediate weakness I decided to share this chart.

Tuesday, April 24, 2012

EURGBP Bottom in place?

EURGBP appears to be creating a double bottom with it's mid-2010 low. I believe this level will serve as a launching point for a move which should exceed .908. This presents an excellent risk-reward ratio for this trade. If this chart is correct, it may make more sense to short GBPUSD instead of this pair as I expect EURUSD to remain weak for over the next few years.

Monday, April 9, 2012

EURUSD - Heading higher?

The EURUSD's current set-up either a fairly medium term bullish or imminently long term bearish. The line in the sand between these two outcomes is the low of Wave B Blue. I still believe that the Euro has further to run toward the upside as it tends to top after the stock market at significant turns, but it could certainly head in either direction. If it does breakdown, it would project a measured move to at least 1.25. Either case offers significant trading potential.

Tuesday, April 3, 2012

AUDUSD Critical Juncture

AUDUSD remains at a decision point. It can either breakdown to new lows or begin a final impulse higher. This secondary support must not be breached significantly in order for this count to remain valid. Either way this breaks, I expect to see large moves.