 |
| I think it's worth a shot at these levels. This should break to the upside and target around 1.27 given the measured move from a triangle break. |
Thursday, December 15, 2011
EURCHF low risk bullish setup
Tuesday, December 13, 2011
EURUSD to begin Wave 2 higher?
 |
| Today's thrust lower in the EURUSD appears to have completed Wave 1 Green lower. It is currently facing the resistance of the 61.8% retracement of the B Wave as well as the center-line of it's channel. This may be a decent stopping point for the decline. Ideally, I would like to see an end of day rally to create a tail on the today's bar. The coming rally may match Wave A Green's peak in order to set up a massive Head and Shoulders pattern which will be broken in a Wave 3 Green lower. |
Monday, December 12, 2011
Euro heading higher?
 | |||||||||
| EURUSD appears to be completing its B wave Correction lower with a thrust under its channel support. What I have labeled as Wave 4 Black may actually be a part of Wave 3 Black with one more thrust to finish the decline. However, given the proximity to the origin of Wave A, I feel the risk/reward is justified as it is currently labeled. It
feels almost wrong to be bullish on the Euro given all the negative news lately,
but recently commercials have been buying Euros at record levels
according to the COT data. This usually corresponds to significant
bottoms in the EURUSD. |
Wednesday, December 7, 2011
USDHUF set for wave 5 decline?
 |
USDHUF appears to have completed a triangle to finish Wave 4 Green and should soon break to new lows in a Wave 5 Green. The 55 hour moving average has been fairly reliable resistance throughout this impulse lower. Therefore if price moves significantly higher than this moving average it is likely Wave 4 Green is still unfolding in a more complex correction.
This is a pair that I have only recently begun trading, but I feel that it exhibits more defined wave patterns than most highly liquid currency pairs. Perhaps, this is a result of a more localized populace trading this pair than the more liquid crosses, allowing their social mood (and therefore price) to fluctuate in unison.
|
Tuesday, December 6, 2011
USDCAD nearing end of B Wave. Higher Ahead?
 |
USDCAD appears to be very near to completing a Wave B Green low. Given how close the 3rd wave of the current wave C came to the low of Wave A Green, this may develop as an expanded flat. Keep that in mind when placing stops.
|
Thursday, December 1, 2011
S&P 500 Mid-Term Elliott Wave Count
 |
The S&P 500 looks like it has one small rally left in to clear several overhead technically significant resistance lines. This should take prices past the end of Wave A Green and will likely result on most everyone turning bullish allowing the market to finally head lower in a third wave. Get ready for some fireworks!
|
Wednesday, November 30, 2011
S&P 500 B Wave Correction potentially complete
 |
| The S&P 500 appears to have complete a 3 Wave correction and should continue to make new highs tomorrow and possibly thursday also before a large impulse lower unfolds. |
Tuesday, November 29, 2011
US Dollar Index Mid-Term Update
 |
I am not sure if what I have labeled as Wave 2 Green is actually only Wave A Blue of Wave 2 Green. This would imply we are nearing the end of a Wave B Blue. If we see the high of Wave 1 Green exceeded, there is a good chance of a breakout much higher.
|
Thursday, November 17, 2011
NZDJPY Nearing Major Trendline Support
 |
NZDJPY appears to be nearing a rally from its recent lows near the trendline which extends back to early 2009. It appears to also be finding support from the previous resistance channel of Wave C Blue. This upcoming rally should lead to prices not seen since 2008.
|
Wednesday, November 16, 2011
S&P 500 Triangle Consolidation Appears Complete
 |
| The S&P 500 appears to have complete a B Wave triangle and should now thrust higher to test the May high. A thrust from this triangle should propel the S&P 500 to roughly 1315. As triangles are always terminal patterns, I expect very sharp movement lower after this target is hit. |
Monday, November 14, 2011
AUDNZD to fail at 1.3190
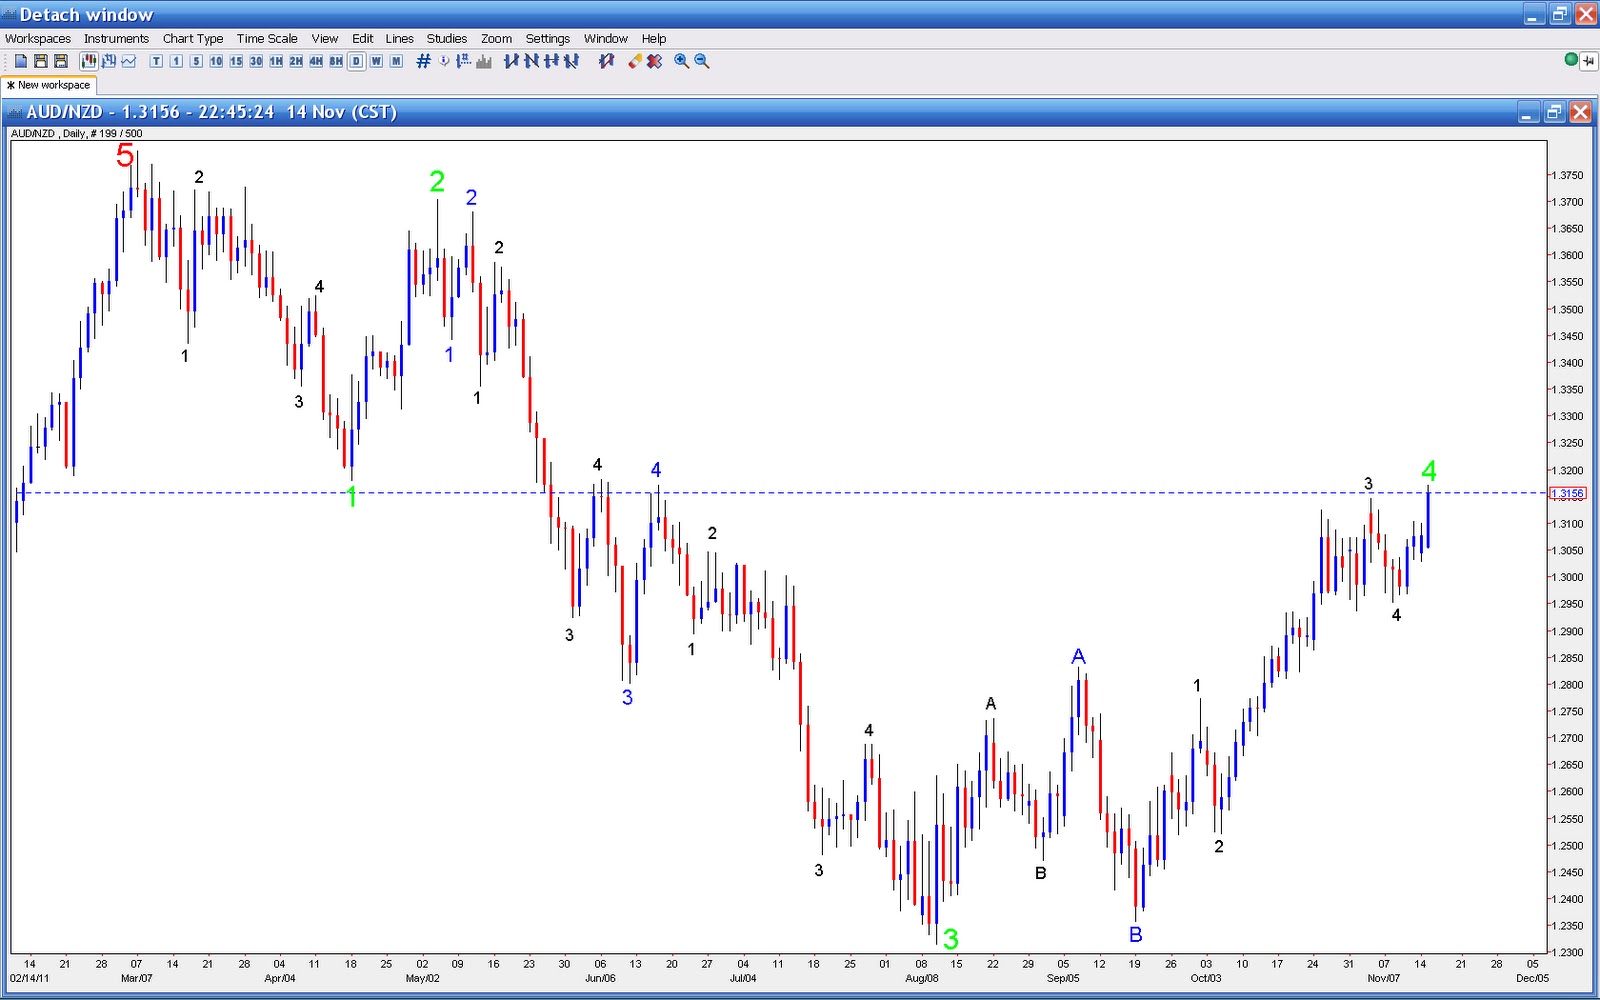 |
| AUDNZD appears to be completing Wave 4 Green which is currently about 30 pips below its invalidation point at 1.3189. The 1.3150 - 1.3200 zone that we are now in has reversed prices on four other occasions in recent months. Furthermore 1.3173 is the 61.8% retracement of the Wave 3 Green decline. Therefore I expect current resistance to hold leading this pair to new lows. *Wave 1 Green must be a leading diagonal as Waves 1 and 4 overlap. |
Wednesday, November 9, 2011
S&P 500 SHTF line
 |
The S&P 500 has survived a test of 1225 which was already major support, but is now where the recent trendline resides. If and when this level of support is taken out, prepare for an extremely sharp long-term move lower. This should coincide with a sustained USD breakout.
|
Tuesday, November 8, 2011
EURCAD to breakdown?
 |
EURCAD appears to be nesting in a series of 1-2, 1-2. This setup indicates that we should see sudden acceleration lower once the key level of support at 1.3780 is broken. The 13 period moving average appears to be have topped and is heading lower. Therefore, I expect a breakdown leading to ~ 1.2300 within a few weeks!
|
Tuesday, November 1, 2011
EURUSD final rally above 1.4000
 |
The EURUSD appears to be catching a bid near the area of the previous 4th of a lesser degree. This leads me to believe that we will see a final Wave C Green which should make highs above the top of Wave A Green. I favor this outcome as long as the 61.8% retracement of the move from Oct 3rd to Oct 26th (around 1.3565) holds as support. However, it is possible that 1.425 is the end of the correction. If that is the case than we still have 5 waves complete, and can expect a corrective rally. In either case I expect higher short term prices.
|
Thursday, October 27, 2011
AUDUSD appears toppy
 |
| AUDUSD appears to be completing an ending diagonal to finish a massive Wave 2 Red counter-trend rally. While Wave C Green does not have a good proportion to wave A Green, I see no other valid wave count at this point. |
Thursday, October 20, 2011
EURAUD Wave 2 Decline appears complete
 |
| EURAUD appears to have completed a three wave decline from the highs and stopped close to a 61.8% retracement of the advance. Prices appear to be back testing the former downtrend resistance line. From here, I expect a strong rise to new highs in a Green Wave 3. |
AUDUSD Hunt Volatility Funnel
 |
| The AUDUSD has set up a large Hunt Volatility Funnel, which if broken should produce a move above High 4 or below Low 3 will produce a 250 pip move from that point in the direction of the break. My preference is that prices will break lower as it has had trouble recently sustaining momentum above its 89 period moving average, but either direction is possible. |
Tuesday, October 18, 2011
AUDUSD 5 Waves Down 3 Waves up Complete
 |
The AUDUSD appears to have completed Green Waves 1 and 2 with Wave 2 being an ending diagonal. There is still the possibility that what I have labeled as the end of wave 2 is only the end of a large Wave A, but I like the look of the count as it stands.
|
Thursday, October 13, 2011
AUDUSD impulsive decline unfolding
 |
AUDUSD appears to have completed an impulsive wave to the downside after reversing at the fibonacci resistance zone (1.0210-1.0230) explained in my last post. I believe this to be a very minor wave of a massive wave 3 decline.
|
Wednesday, October 12, 2011
AUDUSD Correction nearly complete
 |
| AUDUSD appears to be nearing completion. I hesitate to say that it is yet complete as I cannot distinguish all the sub-waves within the fast Wave 5 Blue of Wave C Green. Therefore, I think it is likely that prices still have a little momentum left to touch the Fibonacci resistance zone near where Wave C = 1.618 * A level at 1.0210 and where the 50% retracement of the decline from 1.1080 is located at 1.0230. What should follow should be a spectacular decline to new lows as a third of a third wave begins. |
Monday, October 10, 2011
EURUSD Correction Complete
 |
| The EURUSD appears to have completed a simple zig-zag corrective wave and should be headed for fresh lows. |
Wednesday, October 5, 2011
AUDUSD A Wave nearly complete
 |
AUDUSD appears ready to decline after advancing 5 waves and nearing significant resistance at its 144 hour moving average.
|
Tuesday, October 4, 2011
AUDUSD rally before Wave 3 of 3 of 3 decline!
 |
AUDUSD appears set to rally once more, perhaps close to parity before a large scale decline unfolds in a Wave 3 of 3 of 3. This coming decline is the move I am hoping to catch, so make sure you are not caught off gaurd (ie. use tight stops) if you decide to play this small Wave 2 bounce.
|
Monday, October 3, 2011
S&P 500 ready to rally?
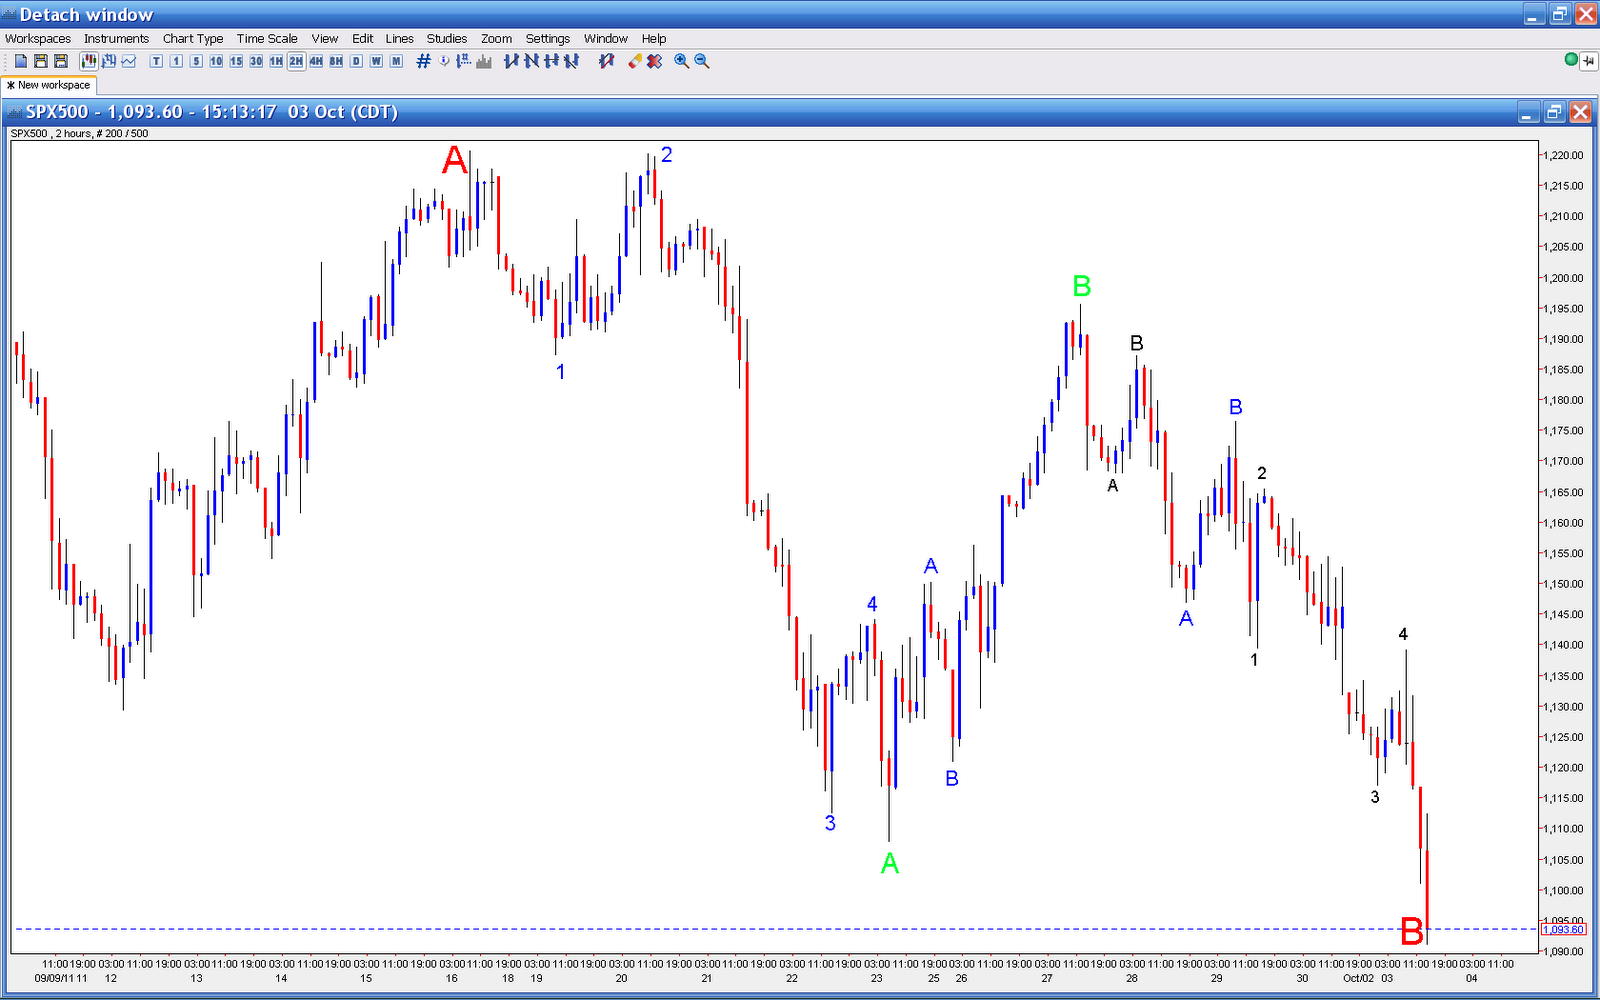 |
| The S&P 500 appears set for a large rally which could potentially take us to new highs above 1220. Looking back at the price action since the August 9th low, it looks extremely corrective. Therefore I do not believe we are in the midst of a 3rd of 3rd Wave just yet. The selling does not appear forceful enough. Currently, Wave C Green (the end of Wave B Red) is not confirming the new RSI lows below Wave A Green on a 2 hour time frame. However, if we break the August 9th lows, fresh selling pressure would be injected giving the 3rd of a 3rd look. There is a way to count price action in this manner; however, wave 1 and 4 overlap requiring it to be labeled as a leading diagonal. I only label in this manner as a last resort, but it is a possibility. I believe we will have final week or so of a strong rally to knock out the weak shorts, followed by a severe decline around October 10th. |
Wednesday, September 28, 2011
EURUSD Still appears corrective
 |
EURUSD appears to have only completed an A Wave and should find support at the decending trendline just below current prices.
|
Tuesday, September 27, 2011
USDJPY Breakout
 |
The USDJPY appears to be breaking out of a multimonth bottoming period which should see the Yen depreciate signifantly in the next several weeks and months. This will leave the US dollar as the only safe haven further accelerating the dollar's ascent. |
Monday, September 26, 2011
Update on EURUSD Long
 |
With the EURUSD recent breakthrough of trendline resistance, there is very little in the way of technical resistance until around 1.3800 (last week's high). However, I do not expect prices to remain at an elevated level for long. |
EURUSD Suprise Bounce
 | ||
| The current EURUSD wave count allows for the possibility of a jump up to 1.3900. I would wait for slightly lower levels to initiate a long positions from near the end of Wave B in order to reduce risk. This should create a head and shoulders pattern with 3 and 5. |
Friday, September 23, 2011
NZDUSD Wave 2 bounce still underway
 |
| NZDUSD appear to have completed Wave B Black and should above the top of Wave A Black in a wave C Black. The next wave down should be violent, so be cautious. |
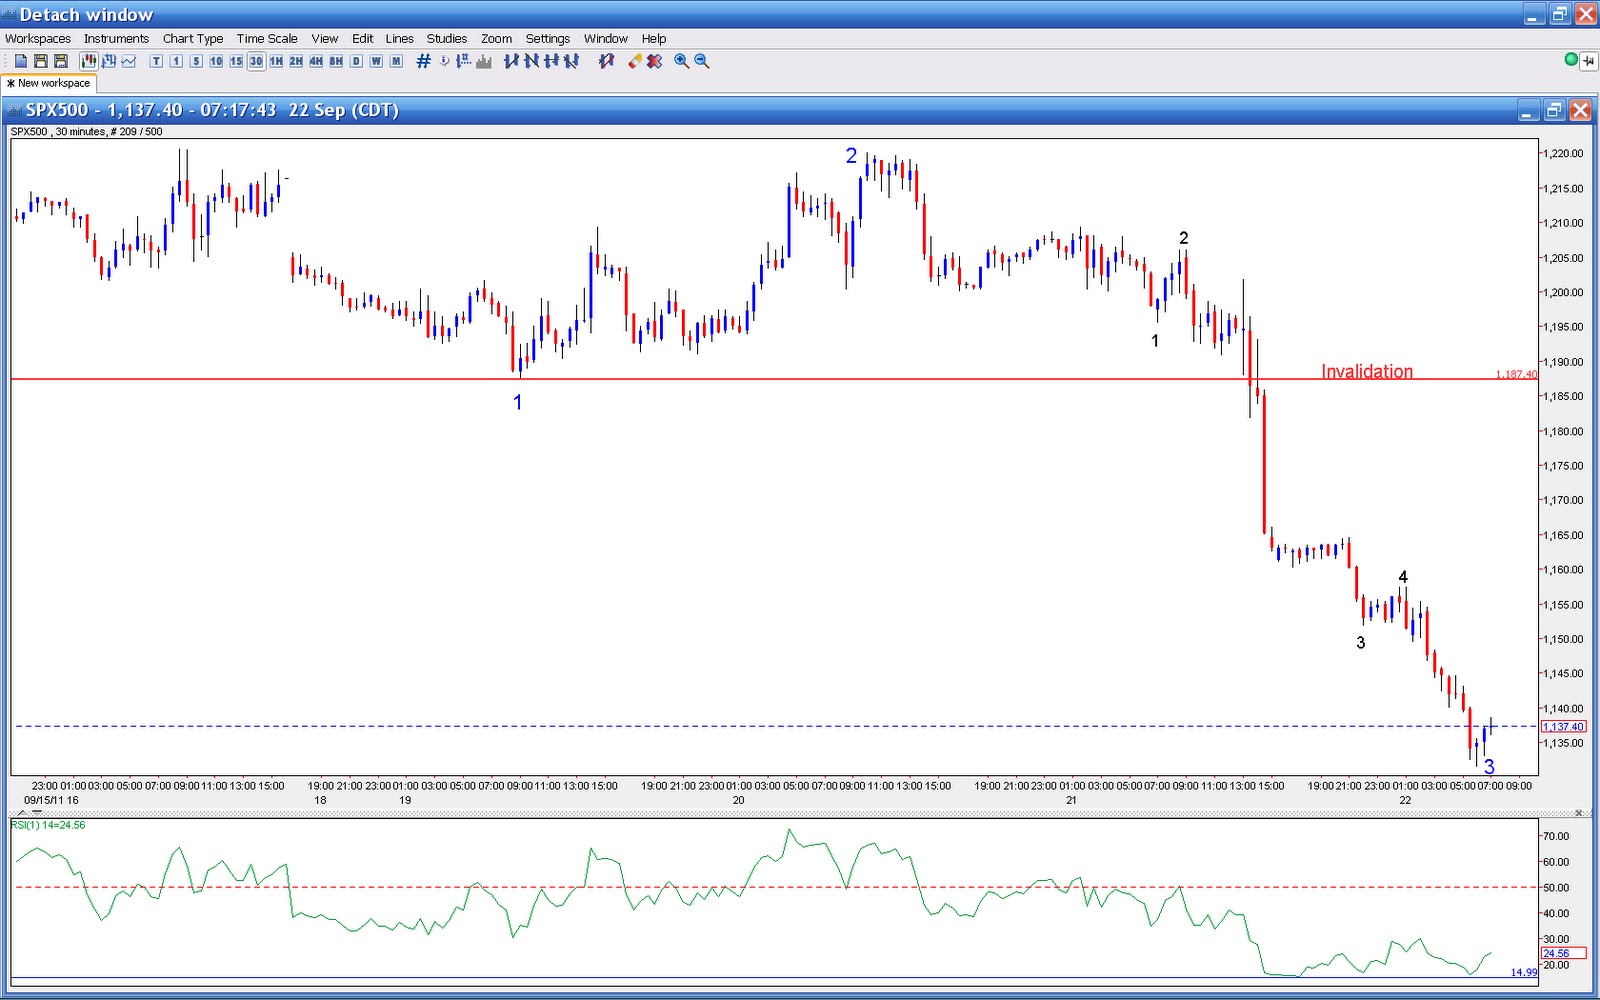
Thursday, September 22, 2011
AUDUSD potential for bounce?
 |
| With current prices at the trendline which has supported AUDUSD higher during its rally from the 2008 lows and just above horizontal resistance from the top of Wave A Green, I believe there is significant potential for a correction higher in the AUDUSD, allowing better shorting opportunities. However, if prices take out the support at .9700, I would expect a much sharper move to the downside to unfold. |
GBPJPY completing multidecade decline?
 |
Looks bullish to me, but there may be more room to spike lower. Be careful. |
S&P 500 to begin Wave 4 up?
 | ||
| The S&P 500 looks set to open much lower than yesterday's close and rally in a correction perhaps the rest of the day. This may be a optimal time to close some dollar long positions in order to resell at a higher price. |
 |
| Here is my current standing in CNBC's Million Dollar Portfolio challenge. All of my trades in this portfolio are based on the research I have posted to this blog. |
Wednesday, September 21, 2011
GBPUSD to bounce in Wave 2?
 |
| GBPUSD appears ready for a bounce higher. I'm rather unsure how far this should rise as I still expect dollar strength to be dominant. It might be worth while trading the British Pound against a weaker currency such as the Euro. Otherwise, not a bad hedge to lock in gains in dollar long positions. *Update - May be a better buy against the Yen as the GBPJPY is only around 20 pips from it's 2008 low. May be a long term double bottom... |
USDJPY finishing decade long impulse wave?
 |
| USDJPY appears to be very close to completing its impulse lower. I believe that we may be forming a double bottom with the low from the Japan Earthquake. Usually I would expect further movement lower as wave 5 seems too small compared to Wave 1 Blue and 3 Blue of Wave 4 Green. However, according to FXJunction.com more than double the number of traders are shorting the pair vs long the pair and this has been true for a several weeks now. The masses (especially novice traders like FXJunction tracks) tend to lose money trading forex. I prefer to bet against their consensus opinions. However there still a possibility that we may see a massive spike lower before prices head back up, similar to the Japan Earthquake spike, so caution is definitely warranted. |
Tuesday, September 20, 2011
S&P 500 Hunt Volatility Funnel & Elliott Wave Count
 |
| The past month and a half has seen a massive compression of volatility in a series of higher lows and lower highs. Once H3 (1221) or L3 (1187) is broken, a significant movement in the direction of the break should be unleashed as large numbers of stops are triggered. |
 | ||||
| Here is the my interpretation of the Elliott Wave Count of the same time span. It implies that we are almost in Wave 3 Blue of 5 Green. Given how the equity indexes have been driving the currency markets lately, this implies further appreciation of the dollar. When the next move occurs, make sure you are on the right side of the trend. |
Monday, September 19, 2011
Hewlitt Packard to make new highs?
 |
I focus on the currency market 99% of the time, but in preparation for CNBC's Million Dollar Portfolio Challenge (which began today), I examined the Elliott Wave Pattern all of the DJIA component stocks to see if any deviated from the DJIA's wave count. I only found 2 of the 30 components have significant bullish potential, Hewlitt-Packard and Wal-Mart. Of these, Hewlitt-Packard seems like a much better bet. With Wave 4 Green only 2 dollars above its invalidation point (the top of Wave 1 Green), the risk to reward is extremely high as HPQ should climb to new all time highs. Also note that Wave A Blue and Wave C Blue have a C equals 1.618 times the length of A relationship. |
Sunday, September 18, 2011
USDCAD to break above parity?
 |
| USDCAD appears ready to move much higher in a powerful Wave 3 Red which should see prices rise to minimum of 1.0725. |
Friday, September 16, 2011
NZDUSD Wave 3 of 3 just ahead?
 |
| NZDUSD may be completing it's second wave after which an extremely powerful decline in a Wave 3 of 3 should unfold. The subdivisions of wave C of 2 Green are not entirely clear. Therefore as long as there is not a close significantly above the 110 period moving average on the 4 hour chart, I believe this count is still valid. If this count is correct the completion of Wave 3 Red should result in the NZDUSD falling to a minimum of .7150. |
Thursday, September 15, 2011
EURUSD heading to new lows!
 |
EURUSD appears to have completed it's 4th Wave correction and should be heading to new lows in a fifth wave. Notice how Wave C Blue ended roughly .618 further than Wave A Blue, as well as just above it's trendline. This is typical of a C Wave. *Wave C must be an ending diagonal to account for the overlap between Wave 1 Black and Wave 4 Black. |
Wednesday, September 14, 2011
EURUSD likely to decline in Wave 4
 |
| EURUSD appears set to decline to the rising support of its current channel as it is likely in an ending diagonal. |
USDJPY short term wave count
 |
| USDJPY appears to be completing a Green 2nd Wave correction and therefore should rally strongly off this test of 76.38 lows assuming that support remains in tact. We will know soon enough! |
Tuesday, September 13, 2011
EURAUD Wave 2 Decline?
 |
EURAUD Appears to have completed a five wave sequence from the lows set early this week. I expect a 40 to 60 percent retracement to unfold, but remember to keep stops tight as the next move should take prices far above current levels. Here is the link to longer term EURAUD to put this price action in perspective. |
Monday, September 12, 2011
NZDUSD Short Term Bearish
 |
NZDUSD Appears to be finishing a 4th Wave Correction. The fifth wave should beyond the end of Wave 3 and coincide with new lows in the S&P 500. |
USDJPY looking bullish
 |
| With the USDJPY approaching significant trendline resistance as well as moving average support, I support establishing long positions near current levels. The Yen is the strongest of the majors against the dollar recently, and I believe that it will shortly play catch up to the rest of the world by depreciating vs the dollar. |
Friday, September 9, 2011
EURAUD Ready to Bounce?
 |
| EURAUD appears to be completing a massive corrective wave after the initial thrust upward. It may still have slightly lower to go but should not exceed the origin of wave 1 at 1.2927. If this level holds we should see a Wave 3 Green take prices well above the highs at 1.4250. Very good risk to potential reward. |
S&P 500 Mid Term Chart Update
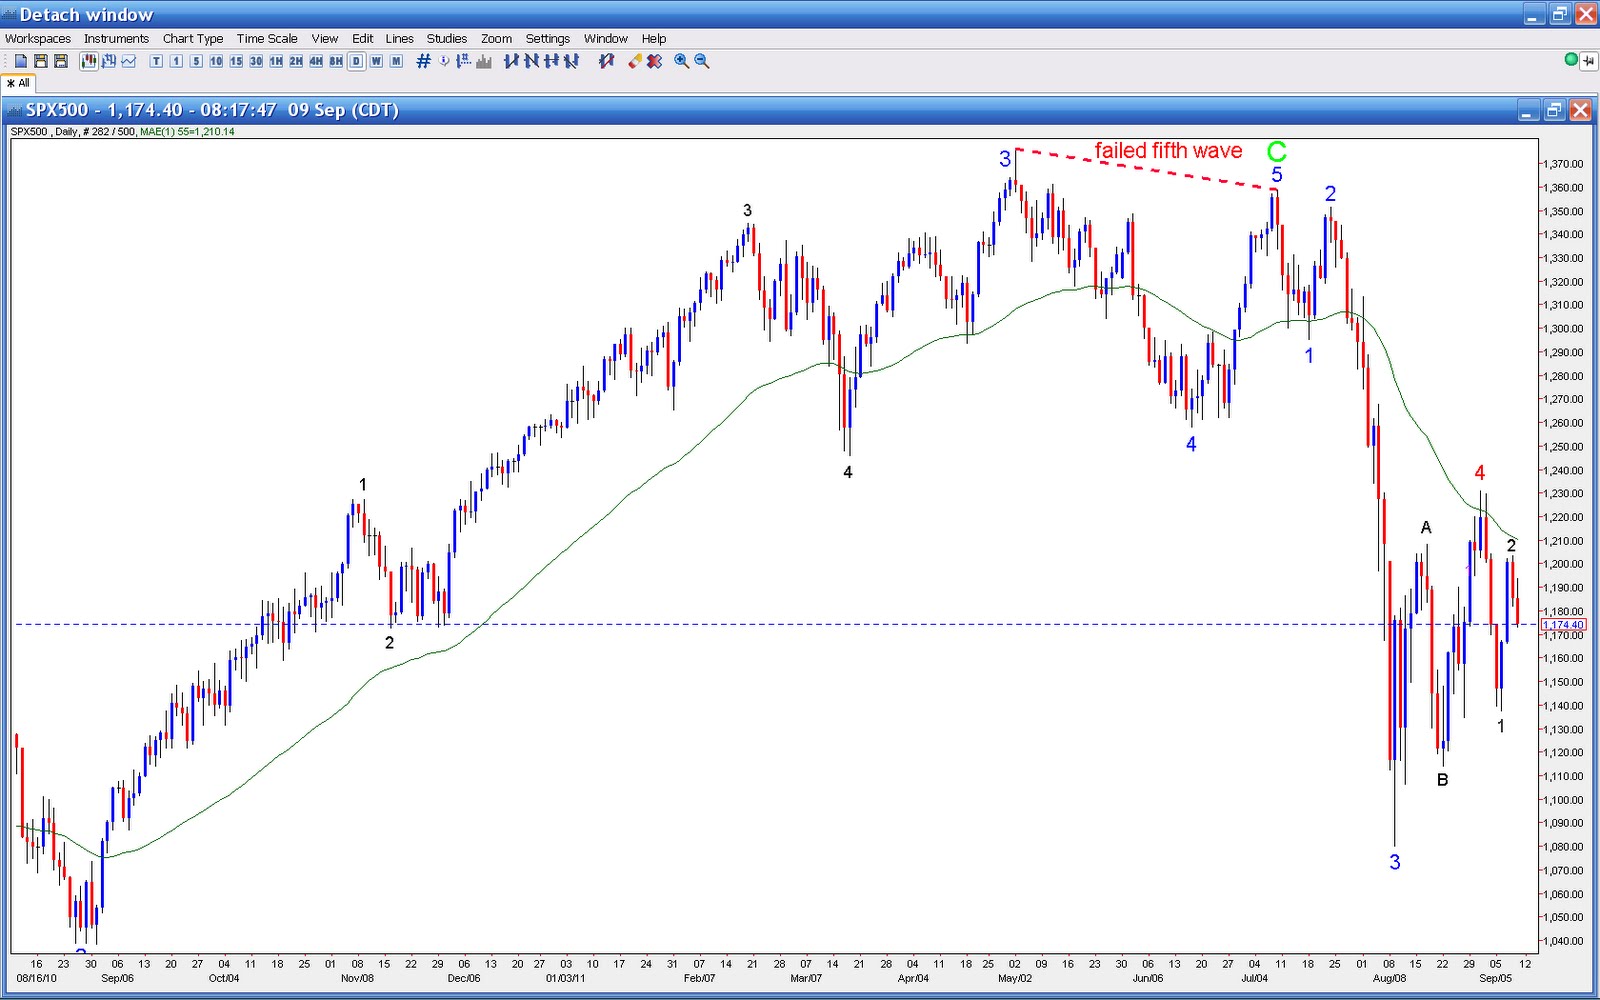 |
| After being rejected again by the 55 day moving average the S&P 500 appears to be set for an extended fifth to complete Wave 1 Green down. I will try to stay ahead of the market and give an update before a sharp short covering rally takes place in Wave 2 Green up. |
Sunday, September 4, 2011
EURUSD Approaching Major Trendline Support
 |
With the Euro approaching the bottom of its trendline since the beginning of the year, there is a real possibility of a major 3rd of a 3rd breakout to the downside for the EURUSD. |
Friday, September 2, 2011
EURCHF - Corrective bounce to come
 |
| EURCHF appears to have completed a massive A wave down covering around 900 pips. Current price action at it's lower channel support suggests that the pair is overstretched with a hammer candlestick forming on the current hourly bar. A modest 3 wave pull back in wave B should return prices at least to the 1.1360 region (4th of a lesser degree) but with potential to climb back to the highs around 1.1900. |
Subscribe to:
Posts (Atom)