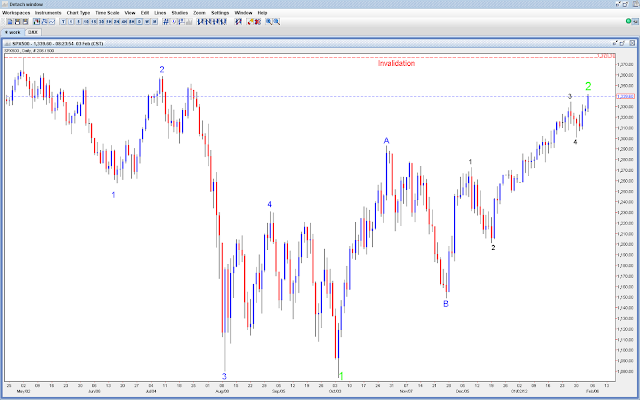
| The Nasdaq has recently achieved a C equals A target of 1 to 1. Given that prices have recently broken above last year's top in the index, many technical analysts are calling this a breakout. I tend to believe this setup is a trap for Wave C Green to surprise with a very rapid decline. Wave C Green cannot equal 61.8% of Wave A Green as it would result in a negative price. Therefore, I am expecting a similar decline in percentage terms. The 2000 to 2002 decline resulted in a 83.5% decline. If this decline is of the same magnitude, the index would fall to roughly 413 over the coming years. |

