 |
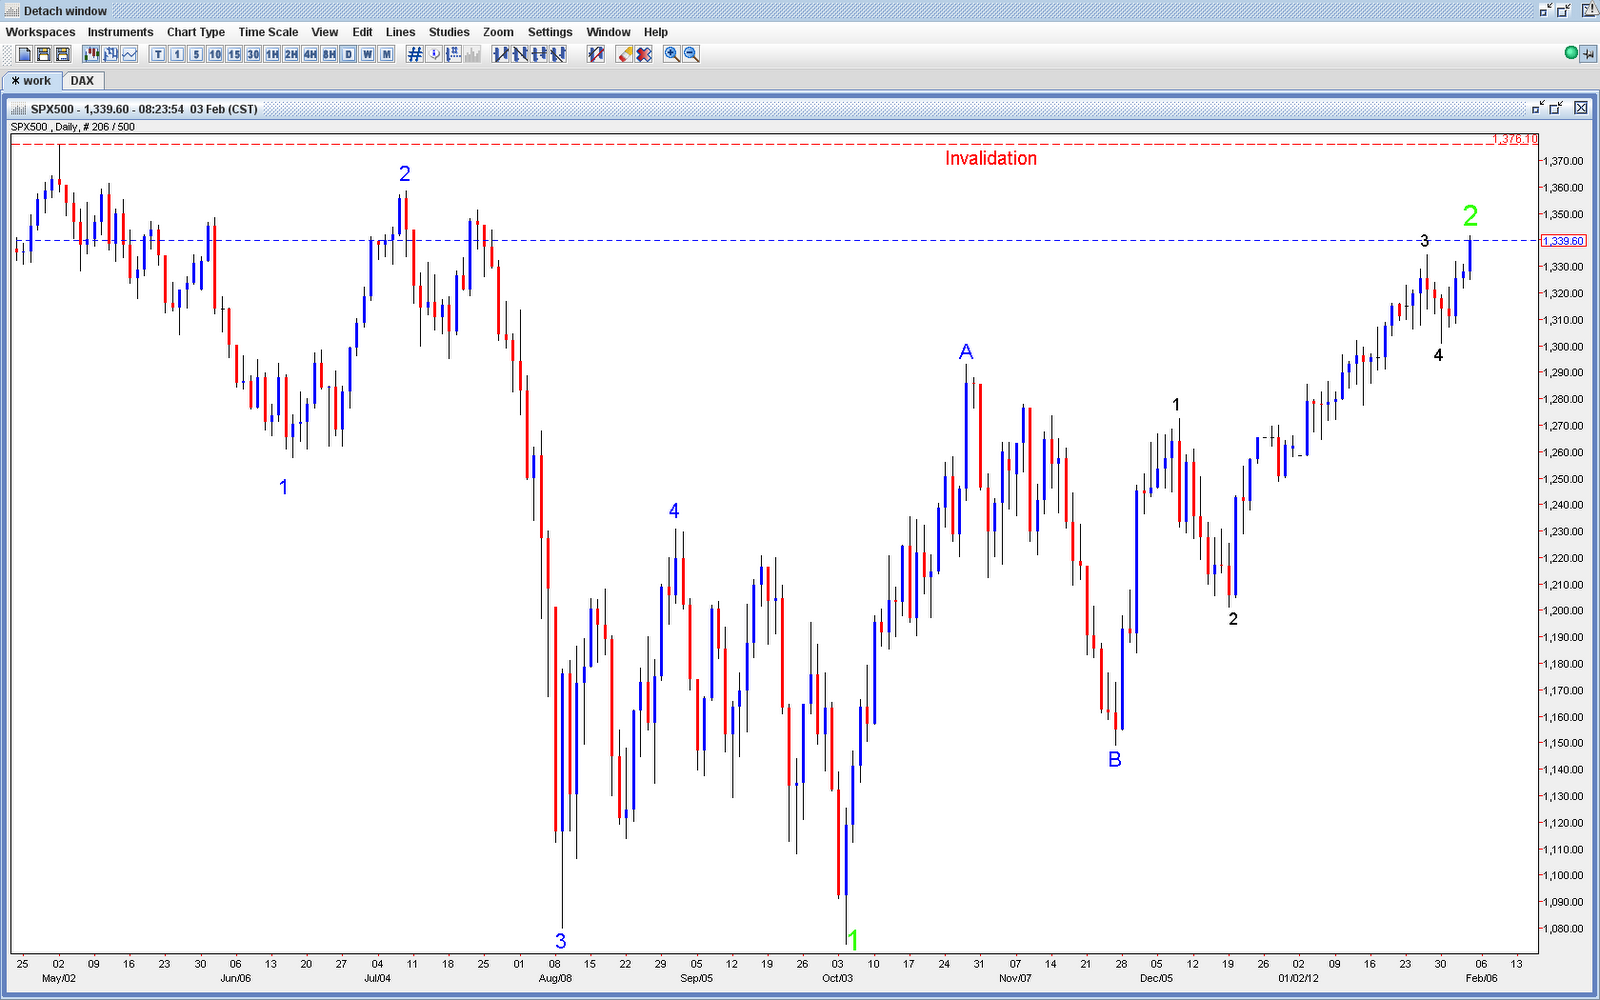
| With today's latest jobs report, the S&P 500 has completed it's minimum pattern for a Wave 5 Black to complete Wave 2 Green. This does not mean that this is the top, but it may be. Prices need to hold below the May 6th high for this count to remain valid. The main point is to remain very cautious as the downside risks are far larger than the upside left. |
Showing posts with label investing. Show all posts
Showing posts with label investing. Show all posts
Friday, February 3, 2012
S&P 500 corrective rally appears complete


Wednesday, November 30, 2011
S&P 500 B Wave Correction potentially complete
 |
| The S&P 500 appears to have complete a 3 Wave correction and should continue to make new highs tomorrow and possibly thursday also before a large impulse lower unfolds. |
Wednesday, November 16, 2011
S&P 500 Triangle Consolidation Appears Complete
 |
| The S&P 500 appears to have complete a B Wave triangle and should now thrust higher to test the May high. A thrust from this triangle should propel the S&P 500 to roughly 1315. As triangles are always terminal patterns, I expect very sharp movement lower after this target is hit. |
Wednesday, November 9, 2011
S&P 500 SHTF line
 |
The S&P 500 has survived a test of 1225 which was already major support, but is now where the recent trendline resides. If and when this level of support is taken out, prepare for an extremely sharp long-term move lower. This should coincide with a sustained USD breakout.
|
Tuesday, August 30, 2011
S&P 500 Short Term Chart
 |
| The recent bounce in the S&P 500 may be ending as it appears to be respecting its descending trendline which connects the lows of April 18th and June 16th. If my wave count is incorrect and price action breaks above the descending trendline, we can expect a sudden move to 1250. |
Sunday, August 28, 2011
S&P 500 Mid Term Chart
 |
| The green line is a 55 period EMA which has shown a tendency to act a significant support and resistance; therefore, the path of least resistance should be lower. |
Subscribe to:
Posts (Atom)