 |
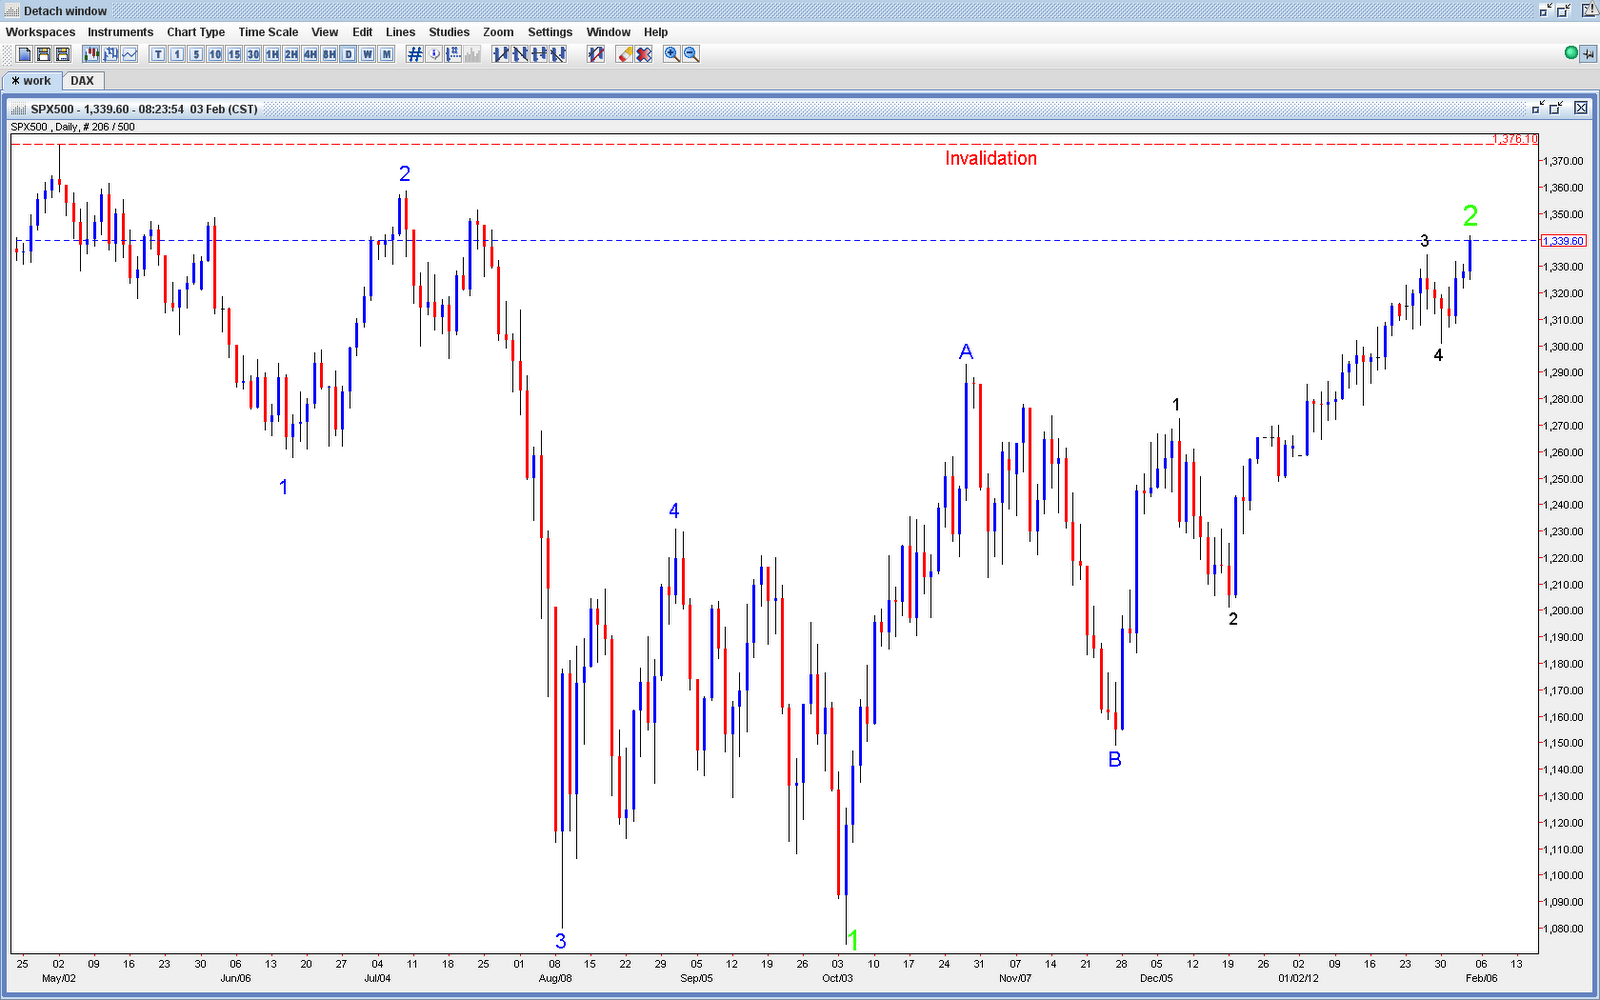
| With today's latest jobs report, the S&P 500 has completed it's minimum pattern for a Wave 5 Black to complete Wave 2 Green. This does not mean that this is the top, but it may be. Prices need to hold below the May 6th high for this count to remain valid. The main point is to remain very cautious as the downside risks are far larger than the upside left. |
Friday, February 3, 2012
S&P 500 corrective rally appears complete


Thursday, February 2, 2012
NASDAQ: Nearing top of decade long correction
 |
| The Nasdaq has recently achieved a C equals A target of 1 to 1. Given that prices have recently broken above last year's top in the index, many technical analysts are calling this a breakout. I tend to believe this setup is a trap for Wave C Green to surprise with a very rapid decline. Wave C Green cannot equal 61.8% of Wave A Green as it would result in a negative price. Therefore, I am expecting a similar decline in percentage terms. The 2000 to 2002 decline resulted in a 83.5% decline. If this decline is of the same magnitude, the index would fall to roughly 413 over the coming years. |
Monday, January 23, 2012
USDCAD Daily and Weekly Wave Counts
 |
| The USDCAD appears set to rally in a fifth wave higher. The breakout from this triangle projects a thrust to roughly the 1.11 level in a fifth wave. This setup offers an amazing risk to reward ratio trade with the invalidation point just below at 1.0050. |
 |
| However when looking at the weekly chart it appears that the upcoming fifth wave will break significant trendline resistance. The last time this occurred (in 2008), prices fell back to the former resistance trendline before exploding higher in an extremely powerful 3rd Wave. I believe a similar situation will present itself relatively soon. Ultimately, prices need to return to 1.3000+ in order to complete this Red Wave C. |
Thursday, January 12, 2012
EURNZD - Possibly concluding 3 year impluse
 |
| The EURNZD appears to be terminating an impulse which began three years ago nearly 10,000 pips higher. The spike on this weeks bar could potentially be the end, however the subdivisions of the current Wave 5 Blue are not readily apparent. A 15 minute view displays an obvious impulse higher. It is possible this merely the beginning of a Wave 4 Black of this Wave 5 Blue. In either case the short term momentum is higher. Therefore, I will attempt to enter into long positions at 1.6100 and 1.6035, with a stop loss at 1.5920. |
Wednesday, January 11, 2012
NZDUSD Wave 2 higher potentially complete
 |
| The New Zealand Dollar vs. the US$ appears to have completed a three wave correction higher off its November lows. This is likely a completed Wave 2 Green higher or perhaps only a three-wave correction in a Wave A Blue higher. In either case however, prices should move lower in the short term. Currently, Wave A Blue and Wave C Blue are roughly equal, and prices are just barely above channel resistance. As the subdivisions of Wave C Blue are labeled, Wave 2 Green cannot terminate above .8045. |
Wednesday, January 4, 2012
EURUSD Trending Higher?
 | |
| It appears that the EURUSD has completed five waves lower to complete a leading diagonal. This is the last leg of that diagonal. As long as prices do not significantly violate the trendline which has now become support, the EURUSD should shortly continue higher in a multi-month rally. |
Thursday, December 15, 2011
EURCHF low risk bullish setup
 |
| I think it's worth a shot at these levels. This should break to the upside and target around 1.27 given the measured move from a triangle break. |
Subscribe to:
Posts (Atom)